Social Icons

#

Thursday, January 15, 2015

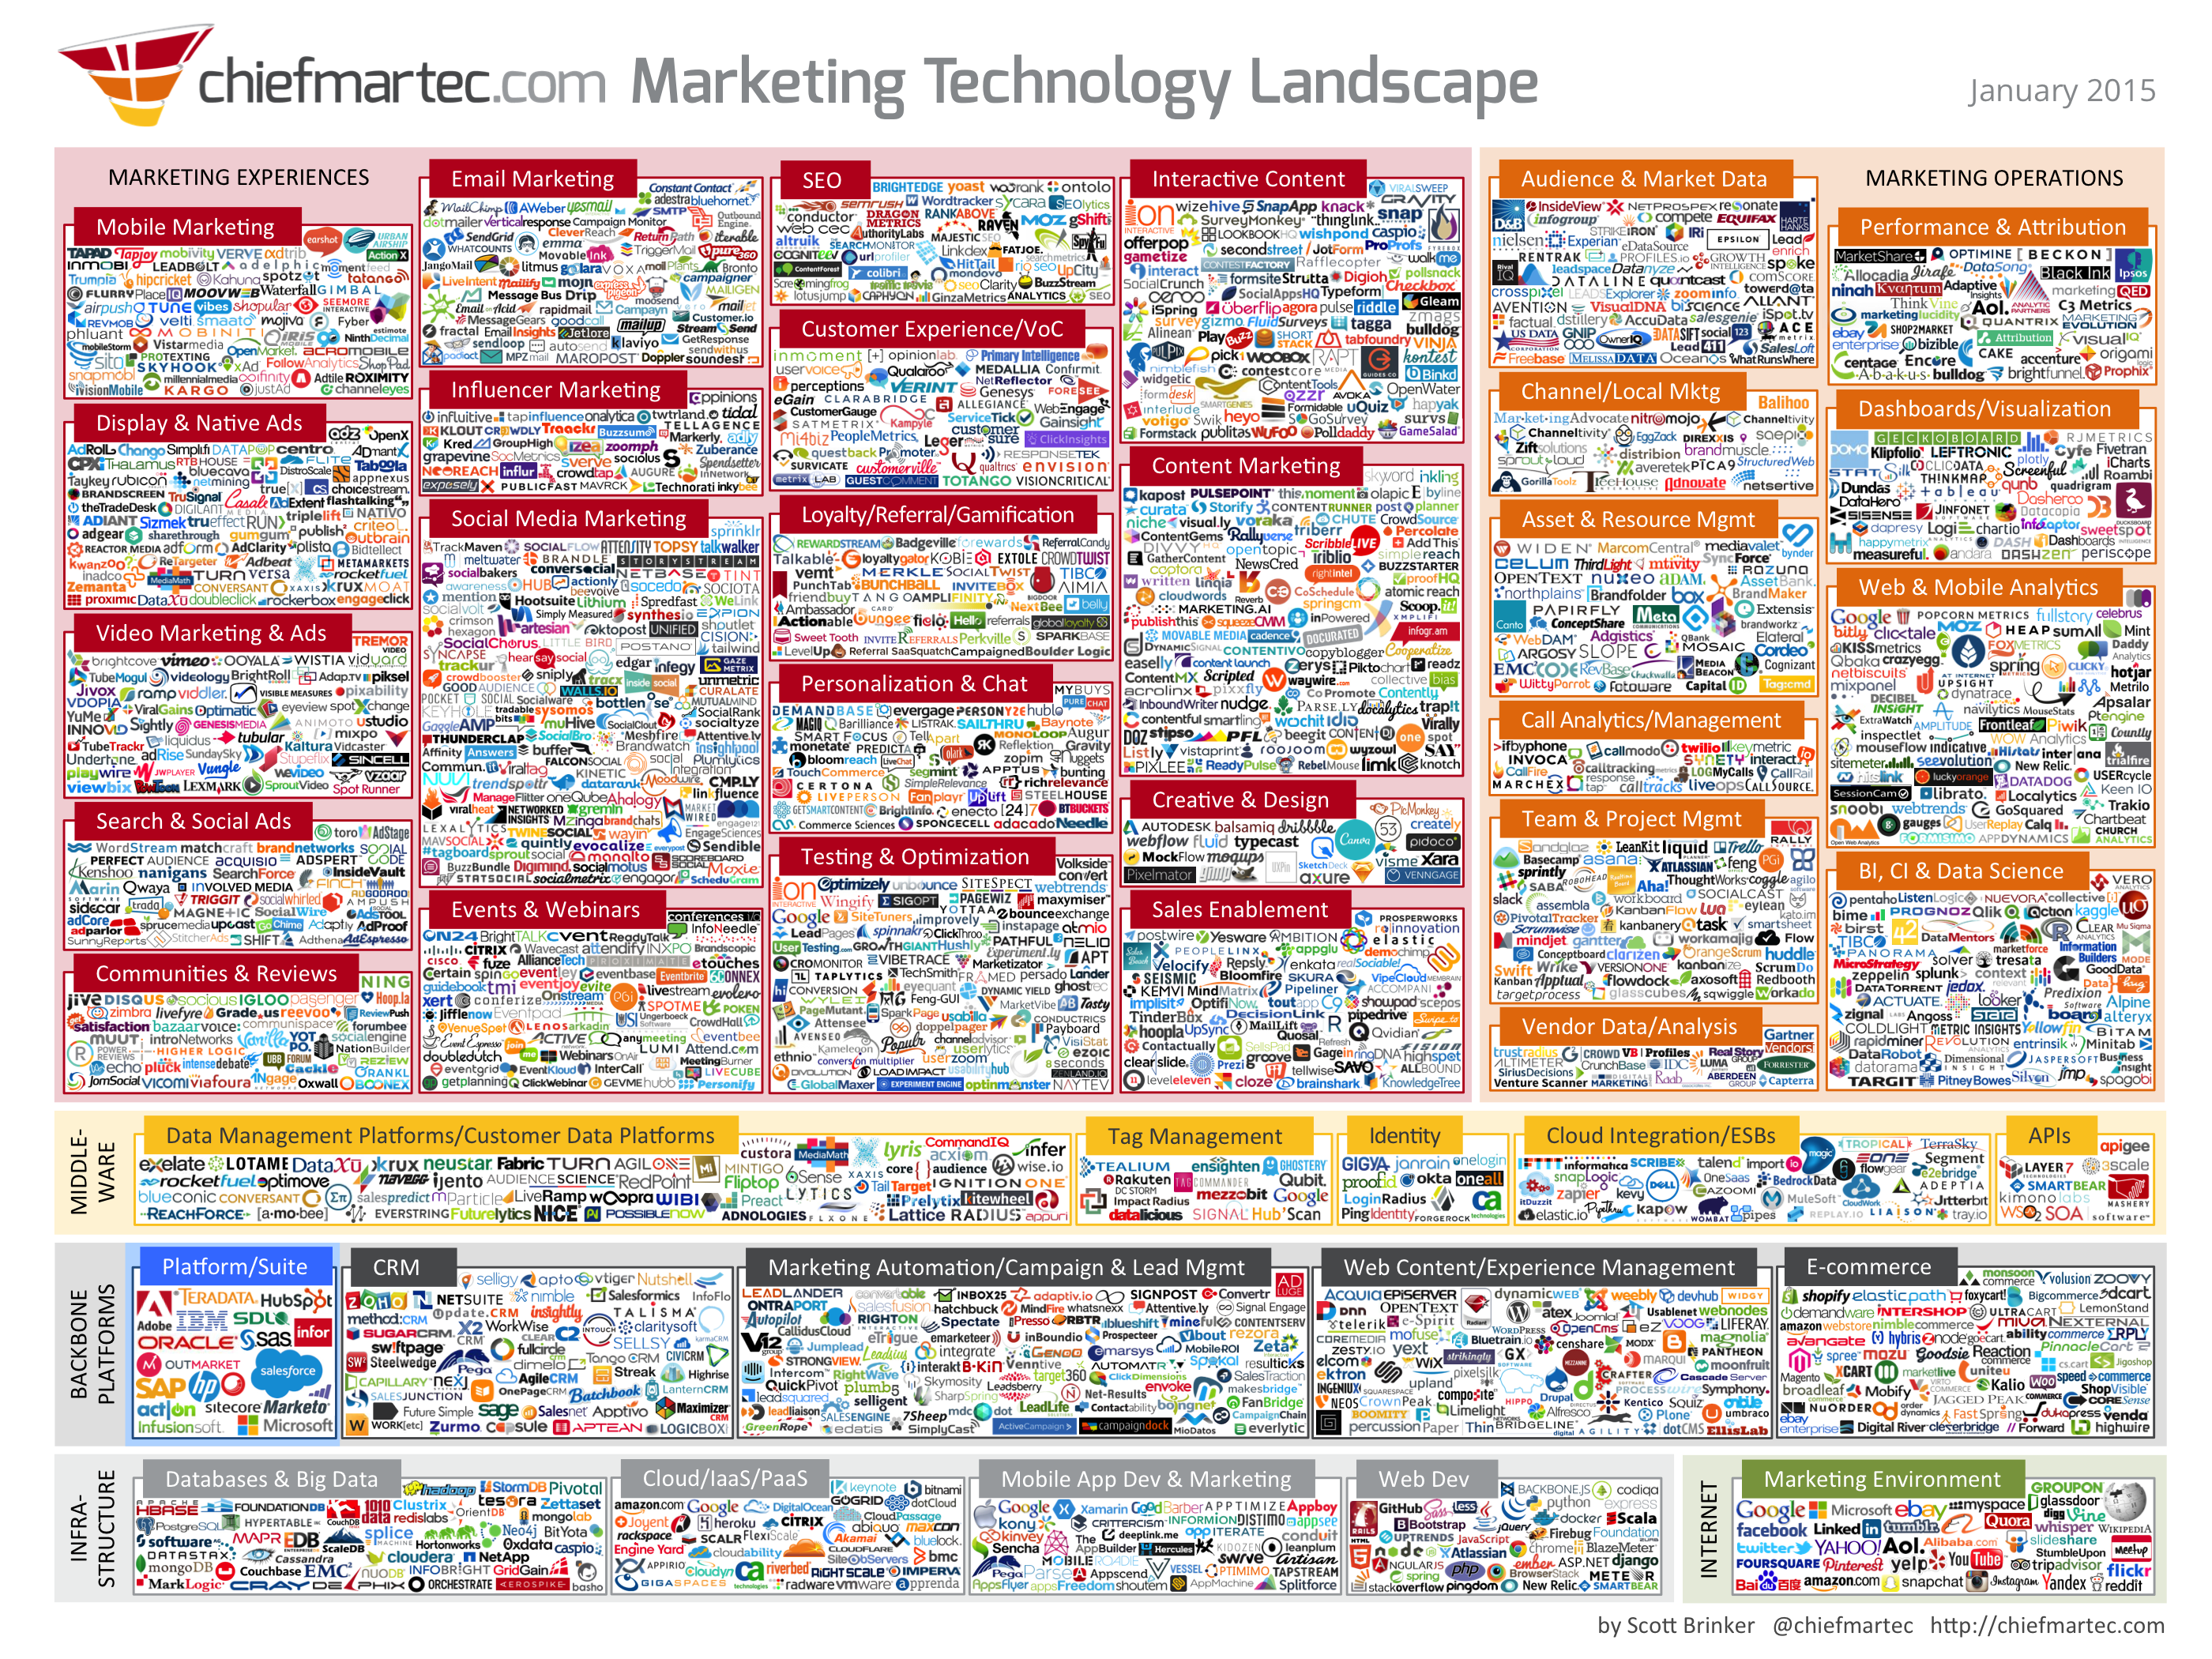
This is how your Marketing Technology Lanscape looks like in 2015…And YES, its confusing….

Technology has and will keep on playing a critical role in your marketing strategy....and its criticality will go two notches up in near future with the emergence of connected homes and "Connected Beings".   The below Marketing Technology Landscape, a long-running graphical view of the Martech space by Scott Brinker of ChiefMartec. This does highlight the complexity that Martech space has in offering but provides a view for a marketer to chart an optimize path/elements to consider for an effective marketing success.

If you finding it confusing, don't worry...its is confusing…..Confusion or delusion is due to the fact that it not only reflects the change in landscape due to ever increasing categories but also a rise of companies from 1,000 last year to nearly 2,000 this year.

 Marketing Technology Landscape 2015

You can also click on the links below for additional size or PDF version:

Further (recommended) read by Scott Brinker on the above chart is available HERE

Monday, January 5, 2015

Meet Mike – Your Customer in 2015

Meet Mike. Mike is your customer in 2015

He is connected and one who checks his smartphone throughout the day, every day, Religiously .

Mike doesn’t pay much attention to your ads but he always has a an opinion on your company, and will happily post his thoughts on social media. He likes to  consult reviews and pay close attention to what his friends think when making a purchase.

And most importantly, Mike is loyal….even in the products he use for his daily rituals. He’s a big fan of your brand, and wants to keep buying your stuff. But if you make a major mistake or lose his trust, Mike will move somewhere else. You know: to your biggest competitor. And in all of this, he wants your product quick…no delays or waiting period…please…To enable it he is willing to go to your store to pick it…

Brands, Meet Your Customer Of 2015 [INFOGRAPHIC]

Wednesday, December 17, 2014

Ten Ways Big Data Is Revolutionizing Manufacturing

McKinsey & Company recently published How Big Data Can Improve Manufacturing which provides insightful analysis of how big data and advanced analytics can streamline biopharmaceutical, chemical and discrete manufacturing.

The article highlights how manufacturers in process-based industries are using advanced analytics to increase yields and reduce costs. Manufacturers have an abundance of operational and shop floor data that is being used for tracking today.  The McKinsey article shows through several examples how big data and advanced analytics applications and platforms can deliver operational insights as well.

The following graphic from the article illustrates how big data and advanced analytics are streamlining manufacturing value chains by finding the core determinants of process performance, and then taking action to continually improve them:

Advanced Analytics Big Data in Manufacturing

Big Data’s Impact on Manufacturing Is Growing

In addition to the examples provided in the McKinsey article, there are ten ways big data is revolutionizing manufacturing:

  • Increasing the accuracy, quality and yield of biopharmaceutical production.  It is common in biopharmaceutical production flows to monitor more than 200 variables to ensure the purity of the ingredients as well as the substances being made stay in compliance. One of the many factors that makes biopharmaceutical production so challenging is that yields can vary from 50 to 100% for no immediately discernible reason. Using advanced analytics, a manufacturer was able to track the nine parameters that most explained yield variation. Based on this insight they were able to increase the vaccine’s yield by 50%, worth between $5M to $10M in yearly savings for the single vaccine alone.
  • Accelerating the integration of IT, manufacturing and operational systems making the vision of Industrie 4.0 a reality. Industrie 4.0 is a German government initiative that promotes automation of the manufacturing industry with the goal of developing Smart Factories. Big data is already being used for optimizing production schedules based on supplier, customer, machine availability and cost constraints. Manufacturing value chains in highly regulated industries that rely on German suppliers and manufacturers are making rapid strides with Industrie 4.0 today.  As this initiative serves as a catalyst to galvanize diverse multifunctional departments together, big data and advanced analytics will become critical to its success.
  • Better forecasts of product demand and production (46%), understanding plant performance across multiple metrics (45%) and providing service and support to customers faster (39%) are the top three areas big data can improve manufacturing performance.   These findings are from a recent survey LNS Research and MESA Internationalcompleted to see where big data is delivering the greatest manufacturing performance improvements today. You can find the original blog post here.

LNS Graphic

  • Integrating advanced analytics across the Six Sigma DMAIC (Define, Measure, Analyze, Improve and Control) framework to fuel continuous improvement.  Getting greater insights into how each phase of a DMAIC-driven improvement program is working, and how the efforts made impact all other areas of manufacturing performance is nascent today. This area shows great potential to make production workflows more customer-driven than ever before.
  • Greater visibility into supplier quality levels, and greater accuracy in predicting supplier performance over time.  Using big data and advanced analytics, manufacturers are able to view product quality and delivery accuracy in real-time, making trade-offs on which suppliers receive the most time-sensitive orders.  Managing to quality metrics becomes the priority over measuring delivery schedule performance alone.
  • Measuring compliance and traceability to the machine level becomes possible. Using sensors on all machinery in a production center provides operations managers with immediate visibility into how each is operating. Having advanced analytics can also show quality, performance and training variances by each machine and its operators.  This is invaluable in streamlining workflows in a production center, and is becoming increasingly commonplace.
  • Selling only the most profitable customized or build-to-order configurations of products that impact production the least.  For many complex manufacturers, customized or build-to-order products deliver higher-than-average gross margins yet also costs exponentially more if production processes aren’t well planned.  Using advanced analytics, manufacturers are discovering which of the myriad of build-to-order configurations they can sell with the most minimal impact to existing production schedules to the machine scheduling, staffing and shop floor level.
  • Breaking quality management and compliance systems out of their silos and making them a corporate priority.  It’s time for more manufacturers to take a more strategic view of quality and quit being satisfied with standalone, siloed quality management and compliance systems.  The McKinsey article and articles listed at the end of this post provide many examples of how big data and analytics are providing insights into which parameters matter most to quality management and compliance. The majority of these parameters are corporate-wide, not just limited to quality management or compliance departments alone.
  • Quantify how daily production impacts financial performance with visibility to the machine level. Big data and advanced analytics are delivering the missing link that can unify daily production activity to the financial performance of a manufacturer.  Being able to know to the machine level if the factory floor is running efficiently, production planners and senior managementknow how best to scale operations.  By unifying daily production to financial metrics, manufacturers have a greater chance of profitably scaling their operations.
  • Service becomes strategic and a contributor to customers’ goals by monitoring products and proactively providing preventative maintenance recommendations.  Manufacturers are starting to look at the more complex products they produce as needing an operating system to manage the sensors onboard. These sensors report back activity and can send alerts for preventative maintenance. Big data and analytics will make the level of recommendations contextual for the first time so customers can get greater value. General Electric is doing this today with its jet engines and drilling platforms for example.

Additional sources of information on Big Data in Manufacturing:

Courtesy – Louis Columbus

Tuesday, December 9, 2014

84% Of Enterprises See Big Data Analytics Changing Their Industries’ Competitive Landscapes In The Next Year

87% of enterprises believe Big Data analytics will redefine the competitive landscape of their industries within the next three years. 89% believe that companies that do not adopt a Big Data analytics strategy in the next year risk losing market share and momentum.

These and other key findings are from a Accenture and General Electric study published this month on how the combination of Big Data analytics and the Internet of Things (IoT) are redefining the competitive landscape of entire industries. Accenture and GE define the Industrial Internet as the use of sensor, software, machine-to-machine learning and other technologies to gather and analyze data from physical objects or other large data streams, and then use those analyses to manage operations and in some cases to offer new, valued-added services.

Big Data Analytics Now Seen As Essential For Competitive Growth

The Industrial Internet is projected to be worth $500B in worldwide spending by 2020, taking into account hardware, software and services sales according to Wikibon and previously published research from General Electric. This finding and others can be found on the home page of the Accenture and GE study here: How the Industrial Internet is Changing the Competitive Landscape of Industries.

The study also shows that many enterprises are investing the majority of their time in analysis (36%) and just 13% are using Big Data analytics to predict outcomes, and only 16% using their analytics applications to optimize processes and strategies. Moving beyond analysis to predictive analytics and optimization is the upside potential the majority of the C-level respondents see as essential to staying competitive in their industries in the future.

A summary of results and the methodology used are downloadable in PDF form (free, no opt in) from this link: Industrial Internet Insights Report For 2015.

Key take-aways from the study include the following:

  • 73% of companies are already investing more than 20% of their overall technology budget on Big Data analytics, and just over two in ten are investing more than 30%. 76% of executives expect spending levels to increase. The following graphic illustrates these results:

Figure 1 big data investments

  • Big Data analytics has quickly become the highest priority for aviation (61%), wind (45%) and manufacturing (42%) companies.  The following graphic provides insights into the relative level of importance of Big Data analytics relative to other priorities in the enterprises interviewed in the study:

Figure 2 industry overview

  • 74% of enterprises say that their main competitors are already using Big Data analytics to successfully differentiate their competitive strengths with clients, the media, and investors. 93% of enterprises are seeing new competitors in their market using Big Data analytics as a key differentiation strategy.  The single greatest risk enterprises see from not implementing a Big Data strategy is that competitors will gain market share at their expense.  Please see the following graphic for a comparison of the risks of not implementing Big Data strategy.

Figure 3 Unable to Implement

  • 65% of enterprises are focused on monitoring assets to identify operating issues for more proactive maintenance. 58% report having capabilities such as connecting equipment to collect operating data and analyzing the data to produce insights. The following graphic provides an overview of Big Data monitoring survey results:

Figure 4 big data monitoring

  • Increasing profitability (60%), gaining a competitive advantage (57%) and improving environmental safety and emissions compliance (55%) are the three highest industry priorities according to the survey. The following table provides an analysis of the top business priorities by industry for the next three years with the shaded areas indicating the highest-ranked priorities by industry:

Figure 5 industry priorities

  • The top three challenges enterprises face in implementing Big Data initiatives include the following: system barriers between departments prevent collection and correlation of data for maximum impact (36%); security concerns are impacting enterprises’ ability to implement a wide-scale Big Data initiative (35%); and  consolidation of disparate data and being able to use the resulting data store (29%), third. The following graphic provides an overview of the top three challenges organizations face in implementing Big Data initiatives:

Figure 6 challenges for big data analytics

Courtesy – Louis Columbus

Sunday, November 23, 2014

Stop thinking….Start Giving…..A Smile…{Weekend Writing}

I recently discovered the below two great piece of work on YouTube…

We….or at least I have always made an attempt to learn from my heroes or rather the “successful” heroes…Somehow I always managed to mix these two words quite unintentionally – “Success” and “Hero”…but never realized that there is no relevance between these two words. If there is any then it has to be only about how you can be successful in making a small difference for the better in someone’s life, years, months, day or that single moment.

There are many millions of heroes out there of which one may be living your next door, walking besides you, sitting next to you on the train or bus….but they all are anonymous….by bringing that small change I can discover the hero in me…Don’t worry just about how to change those big things in the world but if you can change the structure of someone’s face by bringing a SMILE Smile I hope this weekend, you bring a smile to someone’s face.

Don’t worry if the videos are not in your native language…Even without the subtitle you will understand it…As mentioned in the second video, giving is the best communication….Enjoy the Video…and Keep Smiling….Smile

Wednesday, November 5, 2014

Infographic – Why???

Recently I was researching about the growing importance of info-graphics for marketers…while it was encouraging to see many articulations to prove its importance, but I have to acknowledge that I was a bit underwhelmed by the actual use or embrace this strategic tool of communications…

While I may list its importance due to the mere fact that Studies have found that 90 percent of the information that we remember is based on visual impact. Include that tidbit with the fact that we live in an age where 1.5 billion pieces of content, 140 million tweets, and 2 million videos are created on a daily basis, and you can easily understand why a simple visual aid can make your brand stand out.

Therefore, even with the basis of the fact its still a tool for many reasons avoided by marketers….the primary reasons that seems to be popping up is expensive and lack of expert knowledge. Yes, a work of art cannot be cheap…..and not sure who told you that story telling can be done by someone who don’t understand it.

You need visualizer to draw and you need marketers to explain the story…..and the mashup is what you get in a good info graphic…..While its not necessary that you may want to go with what I am writing but you may want to read and see what people are claiming…One such is below and for the rest….simply Google it…

Embrace this communication tool…as its a perfect blend of what you want to tell and what your consumers want to see.