Tuesday, January 26, 2016


Thursday, October 8, 2015

Monday, October 5, 2015

Friday, October 2, 2015
Thursday, October 1, 2015

Tuesday, September 29, 2015
Cloud Computing Dominates Deloitte’s 2015 Global Venture Capital Confidence Survey
- Cloud computing is the strongest technology investment sector for the third year in a row.
- Biopharmaceuticals and robotics are the two sectors that have gained the greatest venture capital confidence from 2014 to 2015.
- U.S. technology hubs (Silicon Valley/San Francisco, New York, Boston, Los Angeles & Chicago), Israel and Canada dominate while confidence continues to fall in Brazil and other emerging markets.
These and other insights are from Deloitte’s 2015 Global Venture Capital Confidence Survey. You can download a copy here (PDF, no opt-in, 70 pp.). Deloitte has also produced and made available infographics of the key findings here (PDF, no opt-in, 4 pp.). Deloitte & Touche LLP and the National Venture Capital Association (NVCA) collaborated on the eleventh annual survey, which was conducted in May & June of this year. The study assesses investor confidence in the global venture capital environment, market factors shaping industries and investments on specific geographies and industry sectors. Please see page 4 of the study for a description of the methodology.
Key take-aways include the following:
- Global venture capital investors are most confident in cloud computing (4.18). Investors were asked to rate their confidence level in each sector. Confidence levels were measured on a scale of 1 to 5, with 5 representing the most confidence. Basis points indicate year-over-year changes. Mobile(4.05), Internet of Things (3.95) and enterprise software (3.82) are the top four sectors venture capitalists are the most confident in today. Biopharmaceuticals are experiencing the greatest increase in venture capital confidence today. Please the the graphic below for additional details.

- The United States (4.17), Israel (3.90) and Canada (3.60) dominate venture capital investors’ confidence while emerging markets including Brazil continues to fall. U.S. technology hubs including Silicon Valley/San Francisco, New York, Boston, Los Angeles and Chicago continue to retain and reinforce global venture capital investor confidence. The following graphic illustrates global venture capital investor’s confidence by nation.

- Silicon Valley/San Francisco (4.28), New York (3.86) and Boston (3.77) are the top three U.S. metros global venture capital investors have the greatest confidence in. Los Angeles (3.43) and Chicago (3.22) are the fourth and fifth most trusted U.S. metros that venture capitalists have confidence in. $15.2B was invested by global venture capital investors in Silicon Valley/San Francisco according to the Deloitte study. The following graphic compares venture capitalist confidence levels and venture capital investment dollars received in 2015 through Q2.

- Immigration reform (61%) and patent demand reform (36%) are the top two initiatives U.S.-based venture capitalists want addressed by policy leaders. For non-U.S. venture capitalists, tax incentives/credits (50%), infrastructure and job creation (both 41%) are the top two initiatives they would like to see public policy leaders take on in their home country.

- Cloud computing continues across all sectors as the area global venture capital investors have the greatest confidence in. Confidence in biopharmaceuticals grew the fastest of any sector measured by the survey between 2014 and 2015, and this is the first year Deloitte is tracking investor confidence in the Internet of Things (IoT). A sector comparison is provided below.

Courtesy - Louis Columbus
Thursday, June 25, 2015

Wednesday, March 18, 2015
2015 Roundup Of Cloud Computing Forecasts And Market Estimates
 Global SaaS software revenues are forecasted to reach $106B in 2016, increasing 21% over projected 2015 spending levels. A Goldman Sachs study published earlier this year projects that spending on cloud computing infrastructure and platforms will grow at a 30% CAGR from 2013 through 2018 compared with 5% growth for the overallenterprise IT.
Centaur Partners and other firms mentioned in this roundup are seeing more enterprise-size deals for cloud computing infrastructure and applications. While each of these consultancies and research firms have varying forecasts for the next few years, all agree that cloud computing adoption is accelerating in enterprises on a global scale.
Key take-aways from the roundup are provided below:
- By 2018, 59% of the total cloud workloads will be Software-as-a-Service (SaaS) workloads, up from 41% in 2013. Cisco is predicting that by 2018, 28% of the total cloud workloads will be Infrastructure-as-a-Service (IaaS) workloads down from 44% in 2013. 13% of the total cloud workloads will be Platform-as-a-Service (PaaS) workloads in 2018, down from 15% in 2013. The following graphic provides a comparative analysis of IaaS, PaaS and SaaS forecasts from 2013 to 2018. Source: Cisco Global Cloud Index: Forecast and Methodology, 2013–2018. (PDF, free, no opt-in).

- Centaur Partners’ analysis of SaaS & cloud-based businessapplication services revenue forecasts the market growing from $13.5B in 2011 to $32.8B in 2016, attaining a 19.5% CAGR. Centaur provides a useful overview of current market conditions including M&A activity in their latest market overview published this month, Introduction to Centaur Partners: SaaS Market Overview, (PDF, free, no opt-in).

- 42% of IT decision makers are planning to increase spending on cloud computing in 2015, with the greatest growth in enterprises with over 1,000 employees (52%). The top five tech spending increases in 2015 are shown in the following graphic. Source: Computerworld’s 2015 Forecast Predicts Security, Cloud Computing And Analytics Will Lead IT Spending.

- Global SaaS software revenues are forecasted to reach $106B in 2016, increasing 21% over projected 2015 spending levels. Spending on integration, storage management, and database management systems are projected to experience the greatest growth in 2015. These and other key insights are from Forrester’s SaaS software subscription revenue by category show below. Source: Enterprise software spend to reach $620 billion in 2015: Forrester.

- $78.43B in SaaS revenue will be generated in 2015, increasing to $132.57 in 2020, attaining a compound annual growth rate (CAGR) of 9.14%. The following graphic and table provides an overview of Forrester’s Global Public Cloud Computing market size analysis and forecast for the years 2011 to 2020. Source: Institut Sage.

- Spending on cloud computing infrastructure and platforms is expected to grow at a 30% CAGR from 2013 through 2018 compared with 5% growth for the overall enterprise IT. Goldman Sachs estimates that Amazon has taken in $4B in revenue, or 26% of the IaaS and PaaS markets, in the past 12 months. These and other insights and the graphics below are from an analysis of the recent Goldman Sachs cloud computing report. Thank youMichael Coté, Research Director, Infrastructure Software at 451 Research for freely sharing your latest presentation, Cloud State of the Union, 2015. Additional interesting links regarding Goldman Sachs’ recent cloud computing study includeBattle Of Cloud Titans Has Just Begun, Goldman Says and Red Hat: Goldman Cuts to Sell Amidst Bullish Cloud View.


- Security (36%), cloud computing (31%) and mobile devices (28%) are the top 3 initiatives IT executives are planning to have their organizations focus on over the next 12 months. Source: 2015 State of the Network Study, Technology Adoption Trends & Their Impact on the Network (free PDF, no opt in). A summary of the study can be found here: State of the Network 2015.

- IDC predicts that by 2016, there will be an 11% shift of IT budget away from traditional in-house IT delivery, toward various versions of cloud computing as a new delivery model. By 2017, 35% of new applications will use cloud-enabled, continuous delivery and enabled by faster DevOps life cycles to streamline rollout of new features and business innovation. Source: 2015-2017 Forecast: Cloud Computing to Skyrocket, Rule IT Delivery.
- By 2018, IDC forecasts that public cloud spending will more than double to $127.5 billion. This forecast is broken down as follows: $82.7 billion in SaaS spending, $24.6 billion for IaaS and $20.3 billion in PaaS expenditures. Source: Forecasts Call For Cloud Burst Through 2018.
- 27.8% of the worldwide enterprise applications market will be SaaS-based, generating $50.8B in revenue up from $22.6B or 16.6% of the market in 2013. IDC also estimates the overall enterprise applications market in 2013 was $135.9B. Source: IDC Predicts SaaS Enterprise Applications Will Be A $50.8B Market By 2018.
- By 2016 over 80% of enterprises globally will using IaaS, with investments in private cloud computing showing the greater growth. Ovum forecasts that by 2016, 75% of EMEA-based enterprises will be using IaaS. These and other insights are from the presentation, The Role of Cloud in IT Modernisation: The DevOps Challenge (free PDF, no opt in). The graphic below provides an analysis of cloud computing adoption in EMEA and globally.

- Microsoft’s commercial cloud revenue grew 128% in Q3, 2014, while server products and services revenue increased 13%. Source: 2015 Forecast: The Sun is Out for Cloud Computing.
- The SaaS Supply Chain Management (SCM) market is predicted to a $4.4B market by 2018, attaining a 19% CAGR from 2014 to 2018. The following graphic from a recent Accenture study is shown below. Source: Supply Chain Management in the Cloud: How can cloud-based computing make supply chains more competitive?

- Enterprise cloud subscription revenues are forecast to reach $67B by 2018, attaining a CAGR of 17.3% in the forecast period. This and other forecasts on cloud computing adoption are provided in the Apps Run The Clouddownloadable report World’s Cloud Top 500 Applications Vendors: Worldwide Cloud Applications Market Forecast 2014-2018 (free PDF, no opt-in). For a breakout of forecast categories and projected spending please see the blog postWorldwide Cloud Applications Market Forecast 2014-2018.

- By 2018, more than 60% of enterprises will have at least half of their infrastructure on cloud-based platforms. These and other are insights are from the keynote Cloud Business Summit presentation Digital Business, Rethinking Fundamentals by Bill McNee, Founder and CEO, Saugatuck Technology. Source: Digital Business, Rethinking Fundamentals.

Courtesy – Louis Columbus
Monday, February 9, 2015
Big Ideas - 2015
These are the trends and ideas Influencers are focusing on in 2015. This clean info graphic does reflects an interesting shift that we can expect in 2015, and of course, the companies to look after. Personally, I am keeping an eye on LinkedIn, Tesla and SpaceX.
Further, I certainly believe that this will be the year of Bio-sensing Wearable where it will first time could experience the domain of “must haves” from merely being a cool device. Considering the amount of companies (large & small) entering into the space, the 2015 will experience a new dimension…especially after the launch of iWatch in Q1,15.

Friday, January 30, 2015
Where Big Data Jobs Will Be In 2015
 Demand for Computer Systems Analysts with big data expertise increased 89.9% in the last twelve months and 85.40% for Computer and Information Research Scientists.
Demand for Python programming expertise increased 96.9% in big-data related positions in the last twelve months.
These and other key insights are from a recent analysis completed of big data hiring trends using WANTED Analytics, the leading provider of data analytics on the workplace. For purposes of this analysis, the term “big data” is comprised of the four skill sets of data analysis, data acquisition, data mining and data structures. The WANTED Analytics taxonomy references these skill sets when queries are made on the term “big data”.
The company currently maintains a database of more than one billion unique job listings and is collecting hiring trend data from more than 150 countries. WANTED Analytics has never been a client, they provided complimentary access based on my requesting a trial account. Many Forbes readers are interested in staying current on big data hiring trends, which led me to complete this analysis.
Key Take-aways include the following:
- Demand for big data expertise across a range of occupations saw significant growth over the last twelve months. There was a 123.60% jump in demand for Information Technology Project Managers with big data expertise, and an 89.8% increase for Computer Systems Analysts. The following table provides an overview of the distribution of open positions by occupation and the percentage growth in job demand over time.

- The five leading industries with the most job openings requiring big data expertise include Professional, Scientific and Technical Services (27.14%), Information Technologies (18.89%), Manufacturing (12.35%), Retail Trade (9.62%) and Sustainability, Waste Management & Remediation Services (8.20%). The following graphic shows the distribution of open positions between September 1, 2014 to today, December 29, 2014:

- The Hiring Scale is 76 for jobs that require big data skills with 12 candidates per job opening as of December 29, 2014. The higher the Hiring Scale score, the more difficult it is for employers to find the right applicants for open positions. Nationally an average job posting for an IT professional with cloud computing expertise is open just 47 days.

- The median salary for professionals with big data expertise is $103,000 a year. Sample jobs in this category include Big Data Solution Architect, Linux Systems and Big Data Engineer, Big Data Platform Engineer, Lead Software Engineer, Big Data (Java, Hadoop, SQL) and others. The distribution of median salaries across all industries shown below:

- San Jose – Sunnyvale – Santa Clara, CA, San Francisco – Oakland – Fremont, CA, and Washington – Arlington – Alexandria, DC are the top three U.S. employment markets for big data related jobs as of today. Mapping the distribution of job volume, salary range, candidate supply, posting period and hiring scale by Metropolitan Statistical Area (MSA) or states and counties is supported by WANTED Analytics and shown in the following graphic. A summary of the top twenty employment markets is also shown following the map:


- Cisco (NASDAQ:CSCO), IBM (NYSE: IBM) and Oracle (NYSE:ORCL) have the most open big data-related positions today. Cisco, its supplier, partner and support ecosystem companies have 3,613 related big data positions available. The following table shows the top ten big data employers today, the distribution of jobs, and the number of new jobs added over the last year.

- Python programming (96.90%), Linux expertise (76.60%) and Structured Query Language (SQL) (76%) are the three most in-demand skills in positions that mention big data as a requirement. The following table provides an overview of the top 10 most in-demand skills:

Courtesy – Louis Columbus
Wednesday, January 21, 2015
Data Science – What’s Hot and What’s NOT
With data collection happening at every possible step of the consumer funnel and now beyond it, we have access to unprecedented data of consumer that we never had. The challenge emerges when the data is there but we don’t have intention or resource(s) or science to decipher what secret(s) it unveiling . CrowdFlower believe 2015 will be a big year in data science. In simple words - Its not about what company’s have, its now about what they can do with it.
The further argue that the role of the data scientist is also going to go through an evolution where we a Chief Data Scientists will supersede Chief Information Officers when it comes to making key IT and big data related purchasing decisions in the coming year. Overall, companies are going to be paying critical attention to data science and the impact this space will have on organizations of all sizes and focus.
CrowdFlower 2015 Hot & Not List includes:
-
Rich Data vs. Big Data: In 2015, companies will rely on rich data–the volumes of data that have actual relevance–instead of big data, to drive growth.
-
Data of Everything vs. Internet of Things: Our fascination with the Internet of Things isn’t going away but the aggregated data generated from connected devices will add a new layer of value to IoT.
-
Chief Data Scientists (CDS) vs. Chief Information Officers (CIO): In the past, CIOs were the keepers of all things IT but in 2015, Chief Data Scientists will hold the purse strings when it comes to key IT buying decisions that leverage company data.

Thursday, January 15, 2015
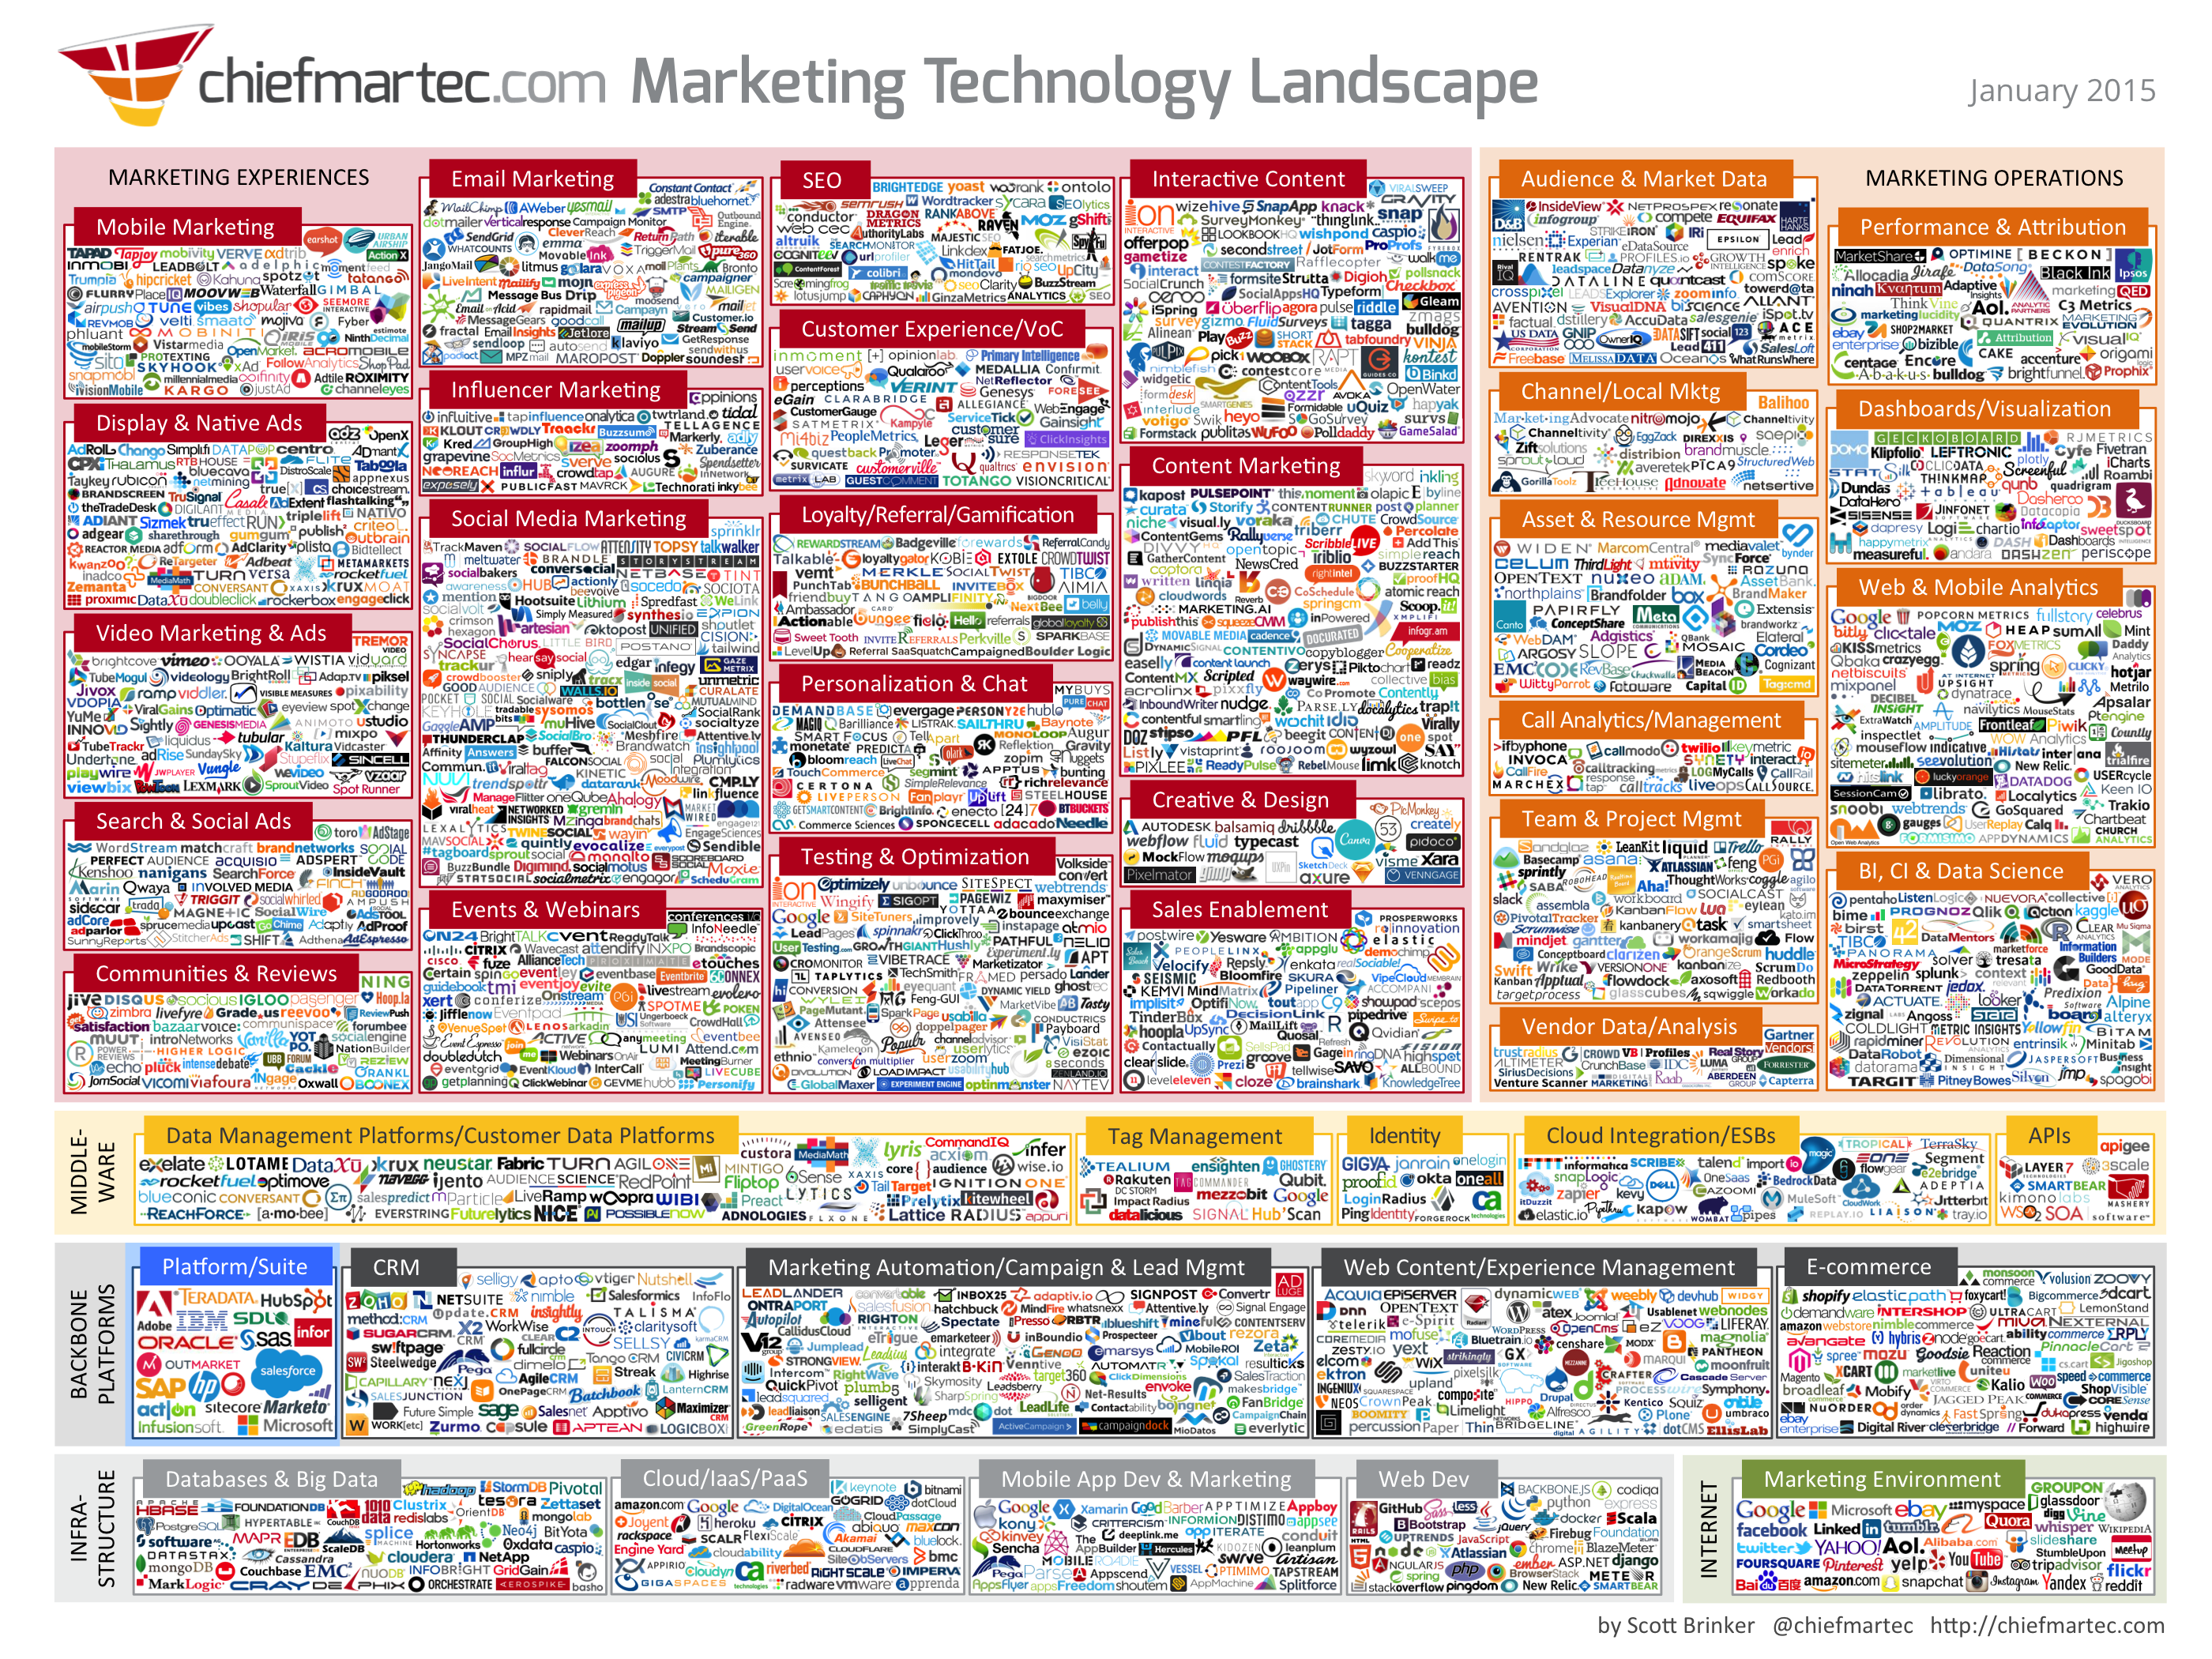
This is how your Marketing Technology Lanscape looks like in 2015…And YES, its confusing….
Technology has and will keep on playing a critical role in your marketing strategy....and its criticality will go two notches up in near future with the emergence of connected homes and "Connected Beings". The below Marketing Technology Landscape, a long-running graphical view of the Martech space by Scott Brinker of ChiefMartec. This does highlight the complexity that Martech space has in offering but provides a view for a marketer to chart an optimize path/elements to consider for an effective marketing success.
If you finding it confusing, don't worry...its is confusing…..Confusion or delusion is due to the fact that it not only reflects the change in landscape due to ever increasing categories but also a rise of companies from 1,000 last year to nearly 2,000 this year.

You can also click on the links below for additional size or PDF version:
- Marketing Technology Landscape — Hi-Res PNG (2800x2100px, 6.5MB)
- Marketing Technology Landscape — Hi-Res PDF (22.5MB)
Further (recommended) read by Scott Brinker on the above chart is available HERE
Monday, January 5, 2015
Meet Mike – Your Customer in 2015
Meet Mike. Mike is your customer in 2015
He is connected and one who checks his smartphone throughout the day, every day, Religiously .
Mike doesn’t pay much attention to your ads but he always has a an opinion on your company, and will happily post his thoughts on social media. He likes to consult reviews and pay close attention to what his friends think when making a purchase.
And most importantly, Mike is loyal….even in the products he use for his daily rituals. He’s a big fan of your brand, and wants to keep buying your stuff. But if you make a major mistake or lose his trust, Mike will move somewhere else. You know: to your biggest competitor. And in all of this, he wants your product quick…no delays or waiting period…please…To enable it he is willing to go to your store to pick it…
![Brands, Meet Your Customer Of 2015 [INFOGRAPHIC]](https://lh3.googleusercontent.com/blogger_img_proxy/AEn0k_vbtpOP2207XMJZ8qDX5P5OkOHvnVSZwTG10x8LcwfXXet9YQp_h8hVw41-RanLTf42sZ6nH1JWo85GeXx1rHwKkujBgpe0emeo0GcZUv6JKRxyDptePejMhjGAoqsAv_984cN7iHqB3WhtKE1Y=s0-d)
Wednesday, December 17, 2014
Ten Ways Big Data Is Revolutionizing Manufacturing
McKinsey & Company recently published How Big Data Can Improve Manufacturing which provides insightful analysis of how big data and advanced analytics can streamline biopharmaceutical, chemical and discrete manufacturing.
The article highlights how manufacturers in process-based industries are using advanced analytics to increase yields and reduce costs. Manufacturers have an abundance of operational and shop floor data that is being used for tracking today. The McKinsey article shows through several examples how big data and advanced analytics applications and platforms can deliver operational insights as well.
The following graphic from the article illustrates how big data and advanced analytics are streamlining manufacturing value chains by finding the core determinants of process performance, and then taking action to continually improve them:

Big Data’s Impact on Manufacturing Is Growing
In addition to the examples provided in the McKinsey article, there are ten ways big data is revolutionizing manufacturing:
- Increasing the accuracy, quality and yield of biopharmaceutical production. It is common in biopharmaceutical production flows to monitor more than 200 variables to ensure the purity of the ingredients as well as the substances being made stay in compliance. One of the many factors that makes biopharmaceutical production so challenging is that yields can vary from 50 to 100% for no immediately discernible reason. Using advanced analytics, a manufacturer was able to track the nine parameters that most explained yield variation. Based on this insight they were able to increase the vaccine’s yield by 50%, worth between $5M to $10M in yearly savings for the single vaccine alone.
- Accelerating the integration of IT, manufacturing and operational systems making the vision of Industrie 4.0 a reality. Industrie 4.0 is a German government initiative that promotes automation of the manufacturing industry with the goal of developing Smart Factories. Big data is already being used for optimizing production schedules based on supplier, customer, machine availability and cost constraints. Manufacturing value chains in highly regulated industries that rely on German suppliers and manufacturers are making rapid strides with Industrie 4.0 today. As this initiative serves as a catalyst to galvanize diverse multifunctional departments together, big data and advanced analytics will become critical to its success.
- Better forecasts of product demand and production (46%), understanding plant performance across multiple metrics (45%) and providing service and support to customers faster (39%) are the top three areas big data can improve manufacturing performance. These findings are from a recent survey LNS Research and MESA Internationalcompleted to see where big data is delivering the greatest manufacturing performance improvements today. You can find the original blog post here.

- Integrating advanced analytics across the Six Sigma DMAIC (Define, Measure, Analyze, Improve and Control) framework to fuel continuous improvement. Getting greater insights into how each phase of a DMAIC-driven improvement program is working, and how the efforts made impact all other areas of manufacturing performance is nascent today. This area shows great potential to make production workflows more customer-driven than ever before.
- Greater visibility into supplier quality levels, and greater accuracy in predicting supplier performance over time. Using big data and advanced analytics, manufacturers are able to view product quality and delivery accuracy in real-time, making trade-offs on which suppliers receive the most time-sensitive orders. Managing to quality metrics becomes the priority over measuring delivery schedule performance alone.
- Measuring compliance and traceability to the machine level becomes possible. Using sensors on all machinery in a production center provides operations managers with immediate visibility into how each is operating. Having advanced analytics can also show quality, performance and training variances by each machine and its operators. This is invaluable in streamlining workflows in a production center, and is becoming increasingly commonplace.
- Selling only the most profitable customized or build-to-order configurations of products that impact production the least. For many complex manufacturers, customized or build-to-order products deliver higher-than-average gross margins yet also costs exponentially more if production processes aren’t well planned. Using advanced analytics, manufacturers are discovering which of the myriad of build-to-order configurations they can sell with the most minimal impact to existing production schedules to the machine scheduling, staffing and shop floor level.
- Breaking quality management and compliance systems out of their silos and making them a corporate priority. It’s time for more manufacturers to take a more strategic view of quality and quit being satisfied with standalone, siloed quality management and compliance systems. The McKinsey article and articles listed at the end of this post provide many examples of how big data and analytics are providing insights into which parameters matter most to quality management and compliance. The majority of these parameters are corporate-wide, not just limited to quality management or compliance departments alone.
- Quantify how daily production impacts financial performance with visibility to the machine level. Big data and advanced analytics are delivering the missing link that can unify daily production activity to the financial performance of a manufacturer. Being able to know to the machine level if the factory floor is running efficiently, production planners and senior managementknow how best to scale operations. By unifying daily production to financial metrics, manufacturers have a greater chance of profitably scaling their operations.
- Service becomes strategic and a contributor to customers’ goals by monitoring products and proactively providing preventative maintenance recommendations. Manufacturers are starting to look at the more complex products they produce as needing an operating system to manage the sensors onboard. These sensors report back activity and can send alerts for preventative maintenance. Big data and analytics will make the level of recommendations contextual for the first time so customers can get greater value. General Electric is doing this today with its jet engines and drilling platforms for example.
Additional sources of information on Big Data in Manufacturing:
- Attitudes on How Big Data will Affect Manufacturing Performance. Posted by Greg Goodwin on Thu, Mar 06, 2014. LNS Research.http://blog.lnsresearch.com/blog/bid/194972/Attitudes-on-How-Big-Data-will-Affect-Manufacturing-Performance-DATA From Value to Vision: Reimagining the Possible with Data Analytics, David Kiron, Renee Boucher Ferguson and Pamela Kirk Prentice, MIT Sloan Management Review, March 2013.http://sloanreview.mit.edu/reports/analytics-innovation/introduction/
- Merck Optimizes Manufacturing With Big Data Analytics, Information Week, Doug Henschen. April 2, 2014. http://www.informationweek.com/strategic-cio/executive-insights-and-innovation/merck-optimizes-manufacturing-with-big-data-analytics/d/d-id/1127901
- Takeaways from the MIT/Accenture Big Data in Manufacturing Conference. Posted by Greg Goodwin on Wed, Nov 27, 2013.http://blog.lnsresearch.com/blog/bid/190482/Takeaways-from-the-MIT-Accenture-Big-Data-in-Manufacturing-Conference
- The Internet of Things and the future of manufacturing. McKinsey and Company. Executives at Robert Bosch and McKinsey experts discuss the technology-driven changes that promise to trigger a new industrial revolution. June 2013 | by Markus Löffler and Andreas Tschiesner.http://www.mckinsey.com/insights/business_technology/the_internet_of_things_and_the_future_of_manufacturing
- The Rise of Industrial Big Data: Leveraging large time-series data sets to drive innovation, competitiveness and growth — capitalizing on the big data opportunity, GE Intelligent Platforms White Paper, April 2012. http://www.ge-ip.com/library/detail/13170
- When Big Data Meets Manufacturing. Stephen Chick, Serguei Netessine, INSEAD Professors of Technology and Operations Management and Arnd Huchzermeier, Chaired Professor of Production Management at WHU-Otto Beisheim School of Management | April 16, 2014.http://knowledge.insead.edu/operations-management/when-big-data-meets-manufacturing-329
Tuesday, December 9, 2014
84% Of Enterprises See Big Data Analytics Changing Their Industries’ Competitive Landscapes In The Next Year
87% of enterprises believe Big Data analytics will redefine the competitive landscape of their industries within the next three years. 89% believe that companies that do not adopt a Big Data analytics strategy in the next year risk losing market share and momentum.
These and other key findings are from a Accenture and General Electric study published this month on how the combination of Big Data analytics and the Internet of Things (IoT) are redefining the competitive landscape of entire industries. Accenture and GE define the Industrial Internet as the use of sensor, software, machine-to-machine learning and other technologies to gather and analyze data from physical objects or other large data streams, and then use those analyses to manage operations and in some cases to offer new, valued-added services.
Big Data Analytics Now Seen As Essential For Competitive Growth
The Industrial Internet is projected to be worth $500B in worldwide spending by 2020, taking into account hardware, software and services sales according to Wikibon and previously published research from General Electric. This finding and others can be found on the home page of the Accenture and GE study here: How the Industrial Internet is Changing the Competitive Landscape of Industries.
The study also shows that many enterprises are investing the majority of their time in analysis (36%) and just 13% are using Big Data analytics to predict outcomes, and only 16% using their analytics applications to optimize processes and strategies. Moving beyond analysis to predictive analytics and optimization is the upside potential the majority of the C-level respondents see as essential to staying competitive in their industries in the future.
A summary of results and the methodology used are downloadable in PDF form (free, no opt in) from this link: Industrial Internet Insights Report For 2015.
Key take-aways from the study include the following:
- 73% of companies are already investing more than 20% of their overall technology budget on Big Data analytics, and just over two in ten are investing more than 30%. 76% of executives expect spending levels to increase. The following graphic illustrates these results:

- Big Data analytics has quickly become the highest priority for aviation (61%), wind (45%) and manufacturing (42%) companies. The following graphic provides insights into the relative level of importance of Big Data analytics relative to other priorities in the enterprises interviewed in the study:

- 74% of enterprises say that their main competitors are already using Big Data analytics to successfully differentiate their competitive strengths with clients, the media, and investors. 93% of enterprises are seeing new competitors in their market using Big Data analytics as a key differentiation strategy. The single greatest risk enterprises see from not implementing a Big Data strategy is that competitors will gain market share at their expense. Please see the following graphic for a comparison of the risks of not implementing Big Data strategy.

- 65% of enterprises are focused on monitoring assets to identify operating issues for more proactive maintenance. 58% report having capabilities such as connecting equipment to collect operating data and analyzing the data to produce insights. The following graphic provides an overview of Big Data monitoring survey results:

- Increasing profitability (60%), gaining a competitive advantage (57%) and improving environmental safety and emissions compliance (55%) are the three highest industry priorities according to the survey. The following table provides an analysis of the top business priorities by industry for the next three years with the shaded areas indicating the highest-ranked priorities by industry:

- The top three challenges enterprises face in implementing Big Data initiatives include the following: system barriers between departments prevent collection and correlation of data for maximum impact (36%); security concerns are impacting enterprises’ ability to implement a wide-scale Big Data initiative (35%); and consolidation of disparate data and being able to use the resulting data store (29%), third. The following graphic provides an overview of the top three challenges organizations face in implementing Big Data initiatives:

Courtesy – Louis Columbus
Wednesday, December 3, 2014

Sunday, November 23, 2014
Stop thinking….Start Giving…..A Smile…{Weekend Writing}
I recently discovered the below two great piece of work on YouTube…
We….or at least I have always made an attempt to learn from my heroes or rather the “successful” heroes…Somehow I always managed to mix these two words quite unintentionally – “Success” and “Hero”…but never realized that there is no relevance between these two words. If there is any then it has to be only about how you can be successful in making a small difference for the better in someone’s life, years, months, day or that single moment.
There are many millions of heroes out there of which one may be living your next door, walking besides you, sitting next to you on the train or bus….but they all are anonymous….by bringing that small change I can discover the hero in me…Don’t worry just about how to change those big things in the world but if you can change the structure of someone’s face by bringing a SMILE 
Don’t worry if the videos are not in your native language…Even without the subtitle you will understand it…As mentioned in the second video, giving is the best communication….Enjoy the Video…and Keep Smiling….
Wednesday, November 5, 2014
Infographic – Why???
Recently I was researching about the growing importance of info-graphics for marketers…while it was encouraging to see many articulations to prove its importance, but I have to acknowledge that I was a bit underwhelmed by the actual use or embrace this strategic tool of communications…
While I may list its importance due to the mere fact that Studies have found that 90 percent of the information that we remember is based on visual impact. Include that tidbit with the fact that we live in an age where 1.5 billion pieces of content, 140 million tweets, and 2 million videos are created on a daily basis, and you can easily understand why a simple visual aid can make your brand stand out.
Therefore, even with the basis of the fact its still a tool for many reasons avoided by marketers….the primary reasons that seems to be popping up is expensive and lack of expert knowledge. Yes, a work of art cannot be cheap…..and not sure who told you that story telling can be done by someone who don’t understand it.
You need visualizer to draw and you need marketers to explain the story…..and the mashup is what you get in a good info graphic…..While its not necessary that you may want to go with what I am writing but you may want to read and see what people are claiming…One such is below and for the rest….simply Google it…
Embrace this communication tool…as its a perfect blend of what you want to tell and what your consumers want to see.

Monday, October 27, 2014
Gartner’s Top 10 Strategic Technology Trends For 2015
Gartner presented their top 10 strategic technology trends for 2015 at their annual Gartner Symposium/ITxpo 2014 held in Orlando earlier this month. Computing Everywhere, the Internet of Things (IoT) and 3D Printing are projected to be the three most important strategic technology trends in 2015.
3D Printing Will Continue To Revolutionize Prototyping And Manufacturing
3D printing is forecast to reach a tipping point in the next three years due to streamlined prototyping and short-run manufacturing. Improving time-to-market, ensuring greater accuracy of highly customized products, and reducing production costs over the long-term are three of the many benefits companies are adopting 3D printing for today. Be sure to read Larry Dignan’s excellent post covering the conference and top ten strategic technology trends, 3D printing turns strategic in 2015, says Gartner.
Taking Analytics To The Next Level in 2015
Advanced, persuasive and invisible analytics, context-rich systems, and smart machines also are included in the top 10 strategic technology trends for 2015. Given how quickly analytics is maturing as a technology category, it’s understandable why Gartner ranked this area as the 4th most strategic. In 2015, analytics will move beyond providing dashboards with metrics and Key Performance Indicators (KPIs) to a more intuitive series of applications that give business analysts the flexibility to define models and test them in real-time. Alteryx and Tableau are interesting companies to watch in this area and Tableau Public is worth checking out and learning due to its advanced visualization features (free, opt-in).
Cloud Computing Becomes Part Of The New IT Reality
The last four technology trends Gartner mentions include cloud/client computing, software-defined applications and infrastructure, Web-scale IT and risk-based security and self-protection.
The following graphic provides an overview of the top 10 strategic technology trends for 2015.

Courtesy – Louis Columbus
Wednesday, October 15, 2014
Roundup Of 3D Printing Market Forecasts And Estimates, 2014

3D printing’s potential to revolutionize manufacturing is quickly becoming a reality.
From relatively simple make-to-stock to complex, engineer-to-order production strategies in aerospace, defense, discrete and industrial production, 3D printing technologies are redefining the manufacturing value chain. Investors including venture capitalists, wealth management firms and nearly every market research firm covering high technology has published 3D printing forecasts or market estimates.
A summarized list of 3D printing market forecasts and estimates is provided below:
- Canalys predicts the global 3D printing market will grow from $2.5B in 2013 to $16.2B by 2018, attaining a CAGR of 45.7% in the forecast period. For additional information see 3D printing market to grow to US$16.2B in 2018. The following table compares 2013, 2014 and 2018 forecasts and relative market growth by 3D printers, services and materials.

- IBISWorld forecasts the U.S. market for 3D printer manufacturing in the U.S. will reach $1.4B in 2014, attaining a Compound Annual Growth Rate (CAGR) of 22.8% from 2009 to 2014. The U.S. market will grow at a CAGR of 15.7% from 2014 to 2019. IBISWorld’s report includes market shares, and shows 3D SystemsCorporation with 19.5% followed by Stratasys with 18.4%. You can read the IBISWorld report, 3D Printer Manufacturing in the US, February 2014 here(free, no opt-in).
- IDC predicts that worldwide 3D printer unit sales and installed base will grow at a combined compound annual growth rate of 59% through 2017, with the value of shipments attaining a 27% CAGR in the forecast period. IDC’s excellent presentation titled 3D Printing – A Transformative Opportunity for Print and Manufacturingwritten by Robert Parker and Keith Kmetz was part of the IDC Directions 2014 briefing sessions earlier this year. The following slide from the presentation compares 3D printer market units, installed base and value of shipments. IDC also predicts the Average Selling Value will also drop at a -19% CAGR through 2017.

- The 3D Systems Investor and Analyst Day presentation given June 10, 2014 includes a series of market forecasts and estimates, including an in-depth overview of how 3D Systems is evaluating market opportunities for 3D printing in healthcare. The following graphic is from the 3D Systems Investor and Analyst Day presentation available here:

- 3D printers will grow from a $288M market in 2012 to $5.7B in 2017, attaining an 81.9% CAGR in the forecast period according to research by Wells Fargo Wealth Management. According to this firm’s compiled research, shipments of 3-D printers are expected to grow at a CAGR of 95% a year from 2012 to 2017 with revenue expected to grow at 82% in the same forecast period. Well Fargo Wealth Management found that 3-D printing revenue is estimated to have achieved just 8% of its global market potential as of 2014, making the market opportunity worth $21–$28 billion by 2017. Wells Fargo Wealth Management published the reportBeyond 2014: Evolving Opportunities in Technology providing these insights and the following charts showing the growth of 3D printing shipments and revenue:

- Equity analysts’ forecasts for additive manufacturing (AM) or 3D printing range from $7B by 2020 on an 18% CAGR, to aggressive market scenarios reaching $21.3B by 2020 on a 34% CAGR. Morgan Stanley’s forecast are among the most bullish there are. Deloitte presented these figures at the 2014 Engineering & Construction Conference Bridging Innovation in the Industry Disruptive Technologies and their Impact on E&C. You can find the presentation here and a graphic below from the presentation comparing market forecasts.

- Gartner forecasts that 3D printer shipments will grow to 1.1M units by 2017 attaining a CAGR of 95%, and end user spending will grow to $5.7B, attaining a CAGR of 82% in the forecast period. The presentation 3D Printing: The Hype, Reality and Opportunities – Today written by Pete Basiliere of Gartner is available on SlideShare. A PDF of the presentation is available to Gartner clients here.
- The market for 3D printing products and services grew to $3.07B in 2013 attaining a compound annual growth rate (CAGR) of 34.9%, the highest in 17 years according to Wohlers Associates.According to industry expert Wohlers Associates the growth of worldwide revenues over the past 26 years has averaged 27%, with the CAGR for the past three years (2011–2013) reaching 32.3%.For additional information see the Wohlers Report 2014 Uncovers Annual Growth of 34.9% for 3D Printing and Additive Manufacturing Industry. Wohlers Associates is one of the most knowledgeable firms tracking 3D printing, they have involved in this market for decades.
- 67% of manufacturers surveyed are currently implementing 3D printing either in full production or pilot and 25% intend to adopt 3D printing in the future. A study by Price Waterhouse Cooper (PwC) of 3D printing adoption in the global aerospace industry’s MRO (maintenance, repair and overhaul) parts market estimates $3.4B annual savings in material and transportation costs alone. PWC’s recent report published in June, 3D Printing and the New Shape of Industrial Manufacturing, provides a wealth of insights into the adoption of 3D printing in manufacturing. The following graphic from the report compares adoption rates by small and large firms.

- PwC predicts that within three to five years 3D printing technologies will be used for producing military, commerical and complex weapon parts and system components. In the recent research note 3D Printing: A Potential Game Changer for Aerospace and Defense, PwC provided a 3D printing adoption map, which is shown below. PwC observes that “as quality and speed continue to improve, 3D printing will become a viable process for an ever-increasing number of applications, including traditional production parts. No one knows how rapidly the technology will take to mature, but most experts believe it will make significant strides within the next five years.”

Courtesy – Louis Columbus
Subscribe to:
Posts (Atom)