An interesting InfoGraphics, that is an attempt to provide a visual view of how devices and other elements of consumer and/or our daily life like buying, networking, sharing, playing, etc are getting much more integrated than we would have imagined.
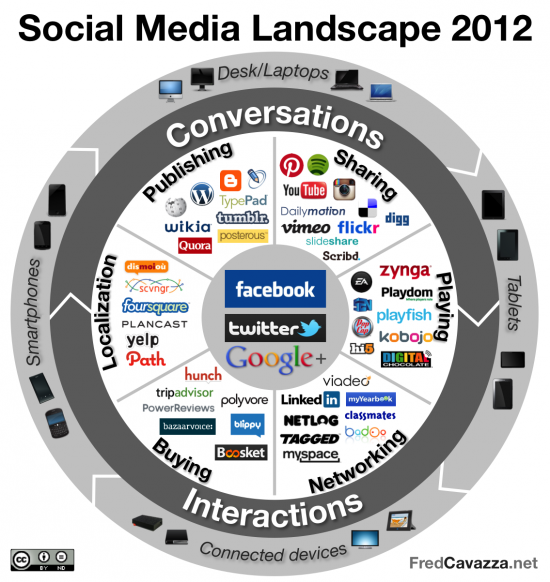
An interesting InfoGraphics, that is an attempt to provide a visual view of how devices and other elements of consumer and/or our daily life like buying, networking, sharing, playing, etc are getting much more integrated than we would have imagined.
Starting this wet and raining week with a nice quiz that I had received in my inbox over the weekend.
How did you do?
The point is, none of us remembers the headlines of yesterday.
Even though these ppl must be d best in their fields... applause dies, awards are tarnished and achievements are forgotten...!!
Here's another quiz...let's see how this goes:
Easier...right? :)
The people who make a difference in your life are NOT the ones with the most awards and loads of money...
Life is full of ordinary people who have made d world a better place 4 u!
Cherish them!!!Hold them tight!!!
Perhaps sometimes its special to be ordinary....!
 By combining search analytics and the latest Gartner forecast on big data published last week, it’s possible to get a glimpse into this areas’ highest growth industry sectors. Big data is consistently a leading search term on Gartner.com, which is the basis of the twelve months of data used for the analysis.
In addition, data from Gartner’s latest report, Big Data Drives Rapid Changes in Infrastructure and $232 Billion in IT Spending Through 2016 by Mark A. Beyer, John-David Lovelock, Dan Sommer, and Merv Adrian is also used. These authors have done a great job of explaining how big data is rapidly emerging as a market force, not just a single market unto itself. This distinction pervades their analysis and the following table showing Total IT Spending Driven by Big Data reflects the composite market approach. Use cases from enterprise software spending, storage management, IT services, social media and search forecasts are the basis of the Enterprise Software Spending for Specified Sub-Markets Forecast. Social Media Analytics are the basis of the Social Media Revenue Worldwide forecast.

Additional Take-Aways

Search Analytics and Big Data
Big data is continually one of the top terms search on Gartner.com, and over the last twelve months, this trend has accelerated. The following time series graph shows the weekly number of inquiries Gartner clients have made, with the red line being the logarithmic trend.

Banking (25%), Services (15%) and Manufacturing (15%) are the three most active industries in making inquiries about big data to Gartner over the last twelve months. The majority of these are large organizations (63%) located in North America (59%) and Europe (19%).


What unifies all of these industries from a big data standpoint is how critical the stability of their customer relationships are to their business models. Banks have become famous for bad service and according to the American Customer Satisfaction Index (ACSI) have shown anemic growth in customer satisfaction in the latest period measured, 2010 to 2011. The potential for using big data to becoming more attuned to customer expectations and deliver more effective customer experiences in this and all services industries shows great upside.
Bottom line: Companies struggling with flat or dropping rankings on the ACSI need to consider big data strategies based on structured and unstructured customer data. In adopting this strategy the potential exists to drastically improve customer satisfaction, loyalty, and ultimately profits.
Courtesy – Louis Columbus
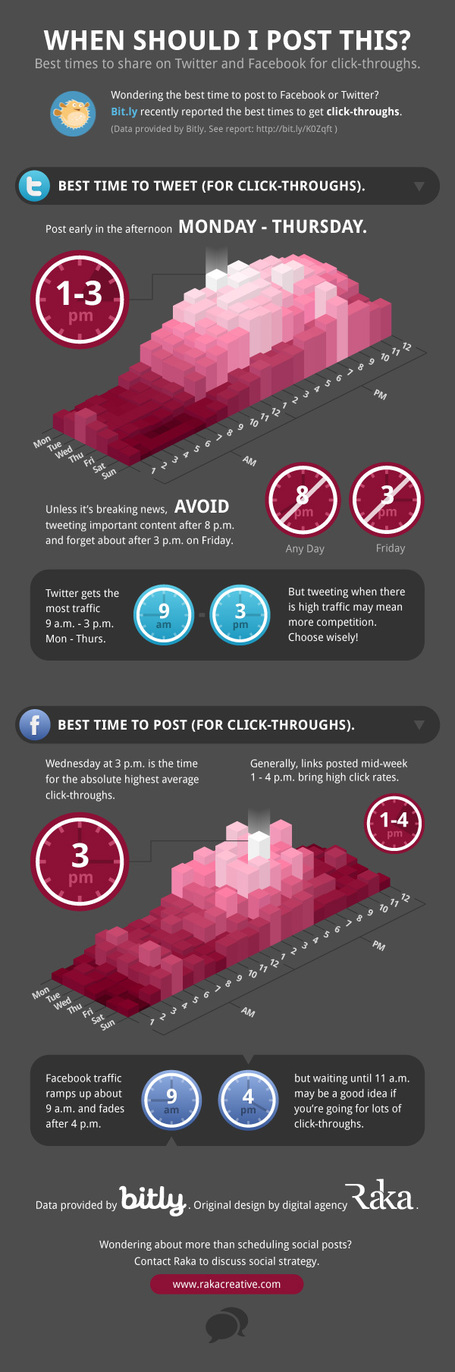
Blogger Labels: Search,Analytics,Into,Gartner,Data,Forecast,areas,growth,industry,sectors,basis,analysis,addition,Rapid,Changes,Infrastructure,Billion,Through,Mark,Beyer,John,David,Lovelock,Sommer,Merv,Adrian,authors,distinction,Total,Driven,enterprise,storage,management,media,Software,Markets,Social,Revenue,Worldwide,Additional,Take,Aways,CAGR,catalysts,Services,departments,sales,ratio,expertise,vendors,Organizations,implementations,solutions,Application,Middleware,categories,From,trend,series,graph,clients,industries,North,America,Europe,standpoint,customer,relationships,Banks,American,Satisfaction,Index,ACSI,expectations,upside,Bottom,Companies,rankings,strategies,strategy,Courtesy,Louis,Columbus,twelve,monthsAs we all know that your readers or potential readers are not online at all the times. They read your post or update on generally at a specific time. Or let me say that your ability to reach to your audience is higher at specific times vs others. You as who is posting information need to understand the trend and identify what time of the day works best for you. Kindly be informed that it may vary based on a lot of factors including (but not limited to) country you are targeting, type of content, your existing reach, influential power of your followers, etc. For the twitter the one tool that I extensively use for such and much broader research on my friends and followers is SocialBro.
While you may be creating the best content for your audience, its equally imperative for you to understand when they are coming to your blog or reading your post.
Kindly note, that the below is only for reference and understanding, however you may need to create your posting schedule based on your need, content and most importantly the country(s) that you are focusing on.
On this Friday, sharing an interesting infographic about one of my and many like me cartoon character – The Mickey Mouse.


Sometimes in life we feel so blue,
But someone, somewhere is not as happy as u.
Somewhere far at the border when a soldier sleeps,
Missing his loved ones he silently weeps.
Somewhere a mother painfully sighs,
Coz her new born baby didn't open her eyes.
Somewhere a poor dad silently cries,
When he sees his son begging for a bowl of rice.
Somewhere in an orphanage a little girl's sad,
When she misses her mom n dad.
So at times a reason to smile u may not have any,
Say to urself that u're happier than many.
Coz life is beautiful and its not always blue,
And someone, somewhere is not as happy as u........